Refer to the information provided in Figure 2.5 below to answer the question(s) that follow.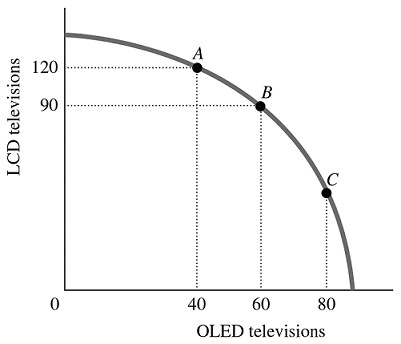 Figure 2.5Refer to Figure 2.5. The best point for society would be
A. either Point B or Point C, as the total amount being produced at either of these points is approximately the same.
B. at any of the labeled points, as all of the points represent an efficient allocation of resources.
C. Point C, as at this point there are approximately equal amounts of LCD and OLED televisions being produced.
D. indeterminate from this information, as we don't have any information about the society's desires.
Answer: D
You might also like to view...
Use the following figure to answer the next question.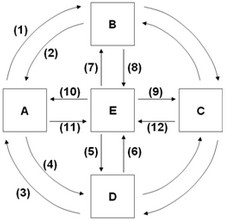 If box E represents government, box D the resource market, and box B the product market, then flows (5) and (7) represent
A. goods and services. B. net taxes. C. resources. D. government expenditures.
Since 1970, the world Gini ratio has ________ indicating that the world distribution of income has ________
A) risen; become more equal B) fallen; become more equal C) risen; become less equal D) not changed; not changed
Refer to Figure 5-3. At the competitive market equilibrium, for the last unit produced
A) the size of the external cost is Pn - Po. B) the size of the external cost is Pm - Po. C) the size of the external benefit is Pn - Po. D) the size of the external benefit is Pm - Po.
If both of two goods have price elasticities of demand, price elasticities of supply, income elasticities of demand and cross elasticities of demand all equal to 2.0: a. They are both normal and substitutes
b. They are both normal and complements. c. They are both inferior and substitutes. d. They are both inferior and complements.