The following comparison line graph indicates the number of vehicles sold for a seven week period by two different salespeople. Use the graph to answer the question.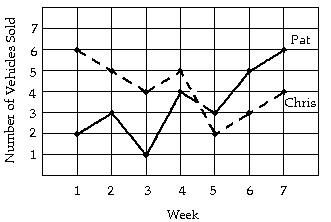 According to this graph, during which week(s) was the difference between Pat's sales and Chris' sales the smallest?
A. Week 4
B. Week 4 and Week 5
C. Week 5
D. Week 5 and Week 6
Answer: B
You might also like to view...
Match the given equation with one of the graphs.x2 + y2 + 4x + 4y = 0
A. 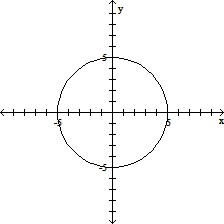
B. 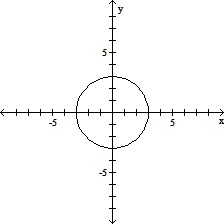
C. 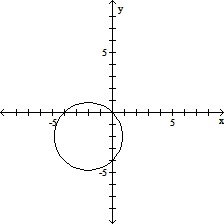
D. 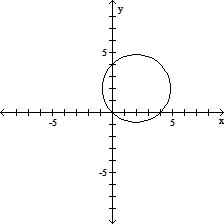
Find the probability.The maker of a certain candy claims that the proportions of colors of candy produced are:  0.4 blue, 0.1 green, 0.1 purple and 0.3 yellow. What is the probability that a randomly selected candy from a
  bag will be blue or red?
A. 0.4 B. 0.1 C. 1 D. 0.5
Solve the problem.Which of the following vectors is parallel to v = 9i + 5j?
A. w = 45i - 25j
B. w =  i -
i -  j
j
C. w = -  i +
i +  j
j
D. w =  i +
i +  j
j
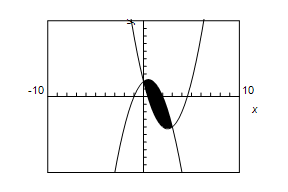
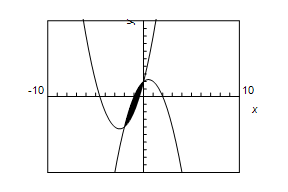
Use a graphing utility to graph the inequalities. Shade the region representing the solution set of the system.
?
? ?
?
A. ? 10

-10?
B. 10
-10?
C. ?10
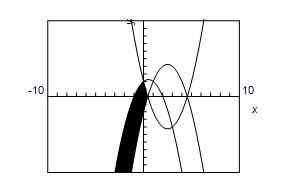
? -10
D. ? 10

-10?
E. 10?
 ?
?
-10