The pictograph below shows the number of television sets sold during the year by each salesperson in a certain company. Use this information to answer the question.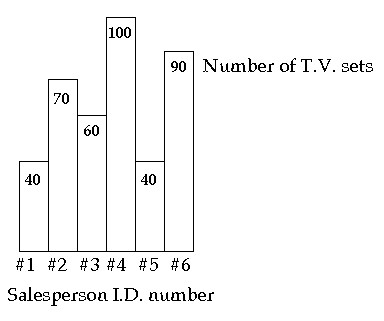 (a) How many more T.V.'s were sold by salesperson #6 than by salesperson #3? (b) How many more T.V.'s were sold by salesperson #3 than by salesperson #1?
A.
| (a) 20 more | (b) 30 more |
B.
| (a) 30 more | (b) 20 more |
C.
| (a) 20 more | (b) 20 more |
D.
| (a) 30 more | (b) 30 more |
Answer: B
Mathematics
You might also like to view...
Find the compound interest earned by the deposit. Round to the nearest cent.$200 at 1.3% compounded annually for 18 years
A. $46.80 B. $44.20 C. $52.35 D. $49.11
Mathematics
Solve the equation.2(1 + 2x) = 8
A. {2} B. {4} C. {-1} D. {1}
Mathematics
The graph of a one-to-one function f is given. Draw the graph of the inverse function f-1 as a dashed line or curve.f(x) = 2x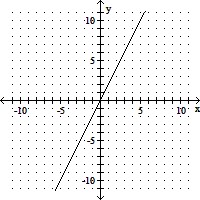
A. 
B. 
Mathematics
Solve the logarithmic equation algebraically. Approximate the result to three decimal places.
?
 ?
?
A. 
B. 
C. 
D. 
E. 
Mathematics