The wages of the employees of a company are presented in this histogram. Answer the question. How many employees earn at least $6 and less than $8 an hour?
A. 34
B. 46
C. 14
D. 20
Answer: A
You might also like to view...
A new chocolate company is estimating how many candy bars per week college students will consume of their line of products. The graph shows the probable number of candy bars students (age 18-22) will consume from year 0 to year 10. B(x) gives the number of candy bars for boys, G(x) gives the number of candy bars for girls, and T(x) gives the total number for both groups. Use the graph to answer the question.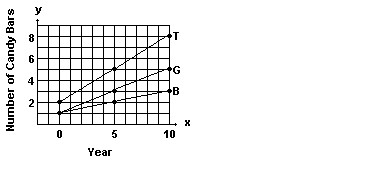 Use the slopes of the line segments to decide in which period (0-5 or 5-10) the number of candy bars per week increased more rapidly.
A. 0-5 B. 5-10 C. The number of candy bars increased at the same rate in both periods
Graph the curve whose parametric representation is given. x = 9 cos t , y = -4 sin t, 0 ? t ? 4?
A. 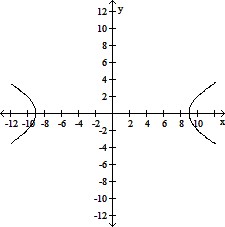
B. 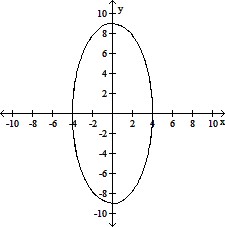
C. 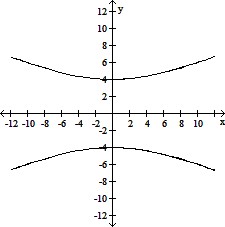
D. 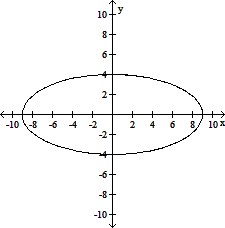
Express the number in scientific notation.870,000
A. 8.7 × 10⁵ B. 8.7 × 10⁴ C. 8.7 × 10⁻⁴ D. 8.7 × 10⁻⁵
Use Newton's method to estimate the requested solution of the equation. Start with given value of x0 and then give x2 as the estimated solution.x4 - 4x + 2 = 0; x0 = 0; Find the left-hand solution.
A. 0.51 B. 0.5 C. 0.57 D. 0.52