Graph the equation by plotting points.x = y2 
A. 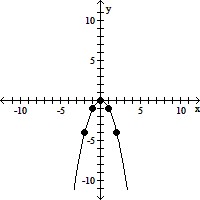
B. 
C. 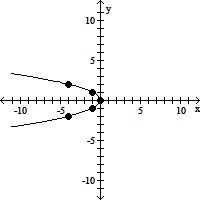
D. 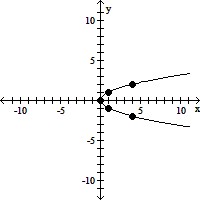
Answer: D
You might also like to view...
Solve for x.4-x = 
A. x = 2
B. x = 
C. x = 
D. x = -2
The following chart gives the average monthly temperatures in Fahrenheit for two cities in Alaska. Use the chart to solve. Round to the nearest tenth of a degree.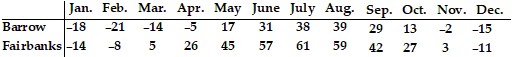 What is the average temperature in Barrow during December, January, and February?
A. -11°F B. -7.5°F C. -14°F D. -18°F
Solve the problem.At a local grocery store the demand for ground beef is approximately 50 pounds per week when the price per pound is $4, but is only 40 pounds per week when the price rises to $5.50 per pound. Assuming a linear relationship between the demand x and the price per pound p, express the price as a function of demand. Use this model to predict the demand if the price rises to $5.80 per pound.
A. p = 0.15x + 11.5; 38 pounds B. p = 11.5x + -0.15; 40 pounds C. p = - 0.15x + 11.5; 38 pounds D. p = - 0.15x - 11.5; 40 pounds
Complete numerical representations for the functions f and g are given. Evaluate the expression, if possible.(f?g)(4)

A. 1 B. Undefined C. 6 D. 8