First, rewrite each equation in exponential form. Then, use a table of coordinates and the exponential form to graph the logarithmic function. Begin by selecting -2, -1, 0, 1 and 2 for y. Finally, based on your graph, describe the shape of a scatter plot that can be modeled by f(x) = log b x, 0 < b < 1.y = log1/7 x
A. 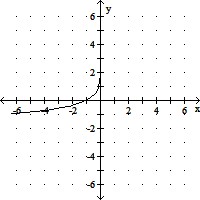
increasing
B. 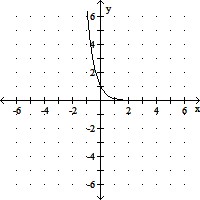
decreasing,
although rate of decrease is slowing down
C. 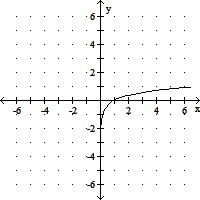
increasing,
although rate of increase is slowing down
D. 
decreasing,
although rate of decrease is slowing down
Answer: D
You might also like to view...
Solve the problem.The diameter of a tree was 9 in. During the following year, the circumference increased  About how much did the tree's diameter increase? (Leave your answer in terms of ?.)
A.  in.
in.
B.  in.
in.
C.  in.
in.
D.  in.
in.
Write an expression for the area of the figure shown. Then simplify the expression. All measures arein inches. 
A.  sq in.
B.  sq in.
C. 15 sq in.
D. 30 sq in.
Write the decimal point in the correct location. 495.89 × 10 = 495890
A. 4958.90 B. 495,890. C. 495.890 D. 49,589.0
Find the mean of the given data set.39, 48, 26, 44, 23
A. 39 B. 48 C. 30 D. 36