Refer to the figure below. A decrease in demand is represented by a shift from: 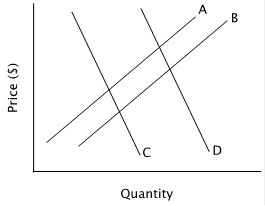
A. curve B to curve A.
B. curve C to curve D.
C. curve A to curve B.
D. curve D to curve C.
Answer: D
You might also like to view...
By 1937, when a new recession began in the midst of the Great Depression,
A) GDP had almost recovered to its 1929 level, but unemployment was still above the 1929 level. B) unemployment had almost fallen back to its 1929 level, but GDP had yet to recover to its 1929 level. C) neither GDP nor unemployment had returned to near their 1929 levels. D) both GDP and unemployment had returned to near their 1929 levels.
On the graph above (and considering the short run only), a combination of a negative demand shock and a negative supply shock may be represented by the movement from point ________ to point ________
A) G; I B) H; F C) H; I D) G; F E) G; H
A price ceiling set below the equilibrium price causes a shortage in the market
a. True b. False Indicate whether the statement is true or false
Figure 6-1
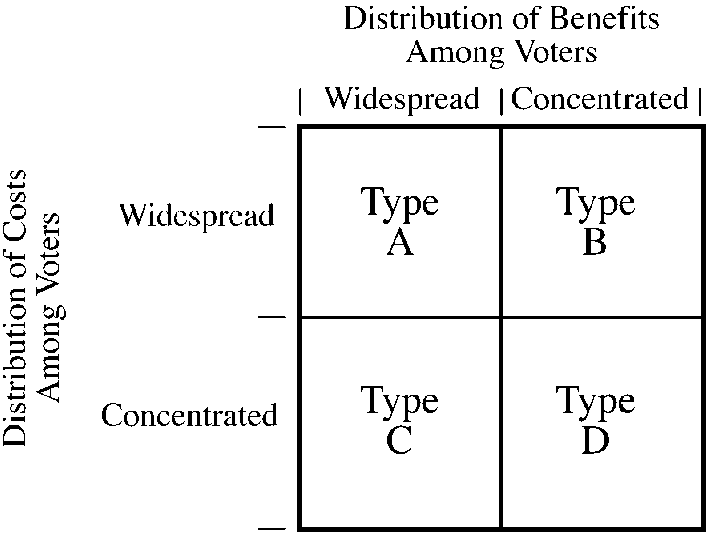
illustrates the four possibilities of the distribution of costs and benefits among voters for a government project. For which type would the government most likely undertake many projects that would be considered inefficient or counterproductive (in other words, do too many of them relative to economic efficiency)?
a.
type A
b.
type B
c.
type C
d.
type D