Solve the problem.The following data represents the average monthly minimum temperature for a certain city in California.  Draw a scatter diagram of the data for one period. Find a sinusoidal function of the form
  that fits the data. Draw the sinusoidal function on the scatter diagram. Use a graphing utility to find the sinusoidal function of best fit. Draw the sinusoidal function of best fit on the scatter diagram.
What will be an ideal response?
y = 8.33 sin (0.50x - 2.06) + 57.97
Mathematics
You might also like to view...
Find a function that satisfies the given conditions and sketch its graph. f(x) = 0,
  f(x) = ?,
 f(x) = ?.
What will be an ideal response?
Mathematics
Evaluate the function. Round to two decimal places.Evaluate  when x = 18.
A. 41.95 B. 77.91 C. 59.93 D. 149.82
Mathematics
Find f'(x) for the function, then find f'(x) for the given x.f(x) = x2 + 7x - 2, f'(0)
A. f'(x) = x2 + 7; f'(0) = 7 B. f'(x) = 2x + 5; f'(0) = 5 C. f'(x) = x2 + 5; f'(0) = 6 D. f'(x) = 2x + 7; f'(0) = 7
Mathematics
Match the equation to the correct graph.y = (x + 7)2
A. 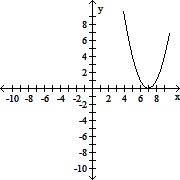
B. 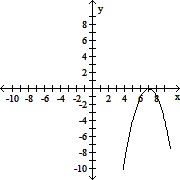
C. 
D. 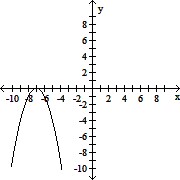
Mathematics