The graph of a function f is given. Use the graph to answer the question.Find the numbers, if any, at which f has a local minimum. What are the local minima?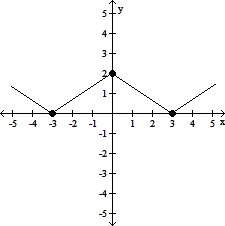
A. f has a local minimum at x = -3; the local minimum is 0
B. f has a local minimum at x = 0; the local minimum is 2
C. f has a local minimum at x = -3 and 3; the local minimum is 0
D. f has no local minimum
Answer: C
You might also like to view...
There are 20 colored chips in a bag, 14 white and 6 red. What are the odds for selecting a red chip?
A. 7 to 3 B. 30% C. 3 to 7 D. 70%
Use the power rules to simplify the expression. Use positive exponents to write the answer.(x-2y5)-2
A. 
B. 
C. 
D. 
The population aged 65 years old and older (in millions) from 2000 to 2050 is projected to be
?
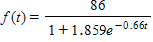

?
where  is measured in decades, with
  corresponding to 2000. What will be the average population aged 65 years and older over the years from 2000 to 2020?
(Hint: The average population is given by  . Multiply the integrand by
  and then use the method of substitution.) Round your answer to one decimal place.
?
A. 180.7 million
B. 43.8 million
C. 57.5 million
D. 87.7 million
E. 33.1 million
Use the coordinates of the indicated points to find the slope of the line.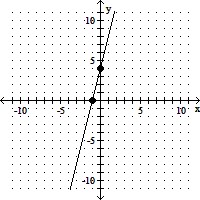
A. - 
B. -4
C. 4
D. 