The following comparison line graph indicates the number of vehicles sold for a seven week period by two different salespeople. Use the graph to answer the question.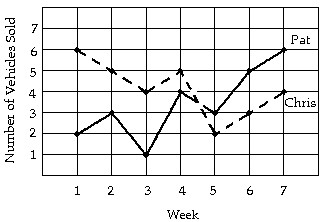 During what week did Pat sell the most number of vehicles?
A. Week 3
B. Week 5
C. Week 7
D. Week 1
Answer: C
You might also like to view...
Find the center of mass of a thin plate of constant density covering the given region.The region bounded by the x-axis and the curve y = 3sin x, 0 ? x ? ?
A.  =
=  ,
,  =
= 
B.  =
=  ,
,  =
= 
C.  =
=  ,
,  =
= 
D.  = ?,
= ?,  =
= 
The lists below show five agricultural crops in Alabama, Arkansas, and Louisiana.AlabamaArkansasLouisianasoybeans (s)soybeans (s)soybeans (s) peanuts (p)rice (r)sugarcane (n)corn (c)cotton (t)rice (r)hay (h)hay (h)corn (c)wheat (w)wheat (w)cotton (t)Let U be the smallest possible universal set that includes all of the crops listed, and let A, K and L be the sets of five crops in Alabama, Arkansas, and Louisiana, respectively. Find each of the following sets.The set of crops common to A, K, and L
A. {n, p, s} B. {n, p} C. {c, h, n, p, r, s, t, w} D. {s}
Write the expression for the general (or nth) term, an, of the geometric sequence.6, -12, 24, -48, 96,. . .
A. an = a1 - 2n B. an = 6(-2)n C. an = 6(-2)n-1 D. an = 6(-2)n
The following table shows the earnings for the Juarez family last year. Use this information to answer the question.MonthEarningsMonthEarningsJan.$1400July$1300Feb.$1150Aug.$2450Mar.$2950Sept.$2500Apr.$2300Oct.$2000May$1650Nov.$2350June$2700Dec.$2400The family saved  of their total income each month. How much savings did they have at the end of June?
A. $1196 B. $1579.50 C. $1690 D. $1508