In 1966, the Catholic Church eliminated the centuries-old requirement that members abstain from eating meat on Fridays. Catholics customarily ate fish on Friday. Following this removal, there was a 12.5 percent fall in prices of fresh fish. From this, it can be deduced that the
A. demand curve for fish shifted to the left.
B. demand curve shifted to the right.
C. supply curve shifted to the left.
D. supply curve shifted to the right.
Answer: A
You might also like to view...
Elasticity of demand equals the ratio of the percentage change in the quantity demanded to the percentage change in the price of the good.
Answer the following statement true (T) or false (F)
"Perfectly competitive firms have total control over the price they set for their product." Explain why the previous statement is correct or incorrect
What will be an ideal response?
The above figure shows the demand and cost curves facing a monopolist. The monopoly maximizes profit by setting price equal to
A) $100. B) $200. C) $300. D) $400.
Figure 3-15
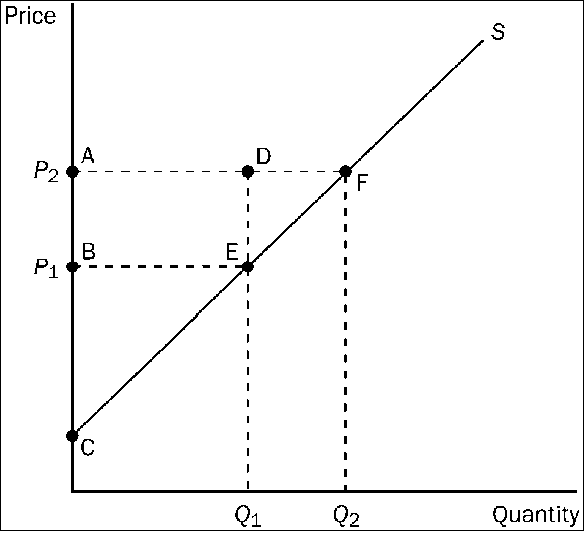
Refer to . Which area represents the increase in producer surplus when the price rises from P1 to P2 due to new producers entering the market?
a.
BCE
b.
ACF
c.
DEF
d.
AFEB