The Lorenz curve
A. shows what portion of the population are living in poverty and what portion are living in wealth.
B. breaks down the income levels of each group in the economy.
C. shows what portion of total money income is accounted for by different proportions of the nation's households.
D. shows what portion of the population is working as professionals, white- and blue-collar, workers and workers at menial tasks.
Ans: C. shows what portion of total money income is accounted for by different proportions of the nation's households.
You might also like to view...
During the Great Depression, economists first began studying the relationship between
A) changes in nominal GDP and changes in real GDP. B) changes in aggregate expenditures and changes in GDP. C) changes in stock prices and changes in price controls. D) changes in GDP and changes in interest rates.
Which of the following contributed to the soaring housing prices during 2002-2004?
a. the Fed's high-interest rate policy b. the tightening of loan standards by commercial lenders c. the increasing popularity of fixed-rate, long-term loans to lock in low interest rates d. the Fed's low-interest rate policy
If a firm converts a previously competitive industry into a monopoly without any changes in the cost curves, it will:
A.) increase output and price to generate more profit. B.) reduce output and raise price to generate more profit. C.) keep output the same but increase price to generate more profit. D.) reduce price and increase output to keep potential competitors from entering the industry.
This graph demonstrates the domestic demand and supply for a good, as well as the world price for that good.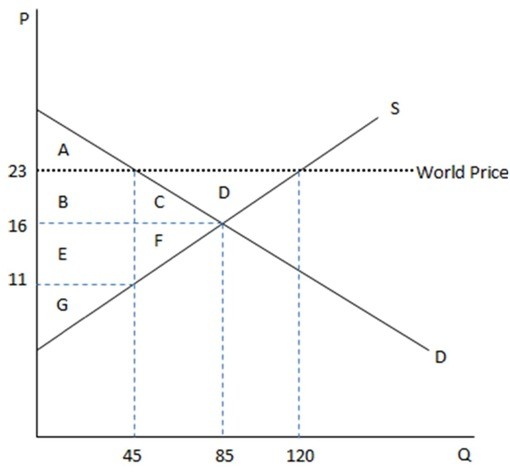 According to the graph shown, if this were depicting an autarky economy, the equilibrium price would be:
A. $23 B. $11 C. $45 D. $16