 In the above figure, if real GDP is $1 trillion, there is
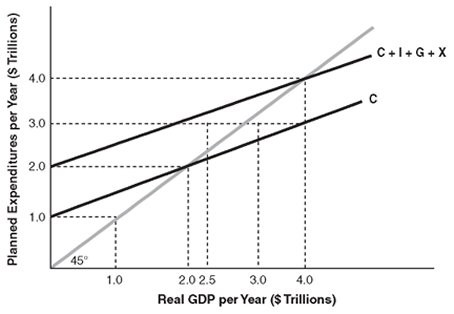
A. positive saving.
B. negative investment.
C. negative consumption.
D. dissaving.
Answer: D
Economics
You might also like to view...
Explain the structure of the circular flow model
What will be an ideal response?
Economics
Refer to the production possibility graph above. Assume that the economy is in equilibrium at point e. If a war reduces the country's capital stock by 40%, the new equilibrium is most likely to be
A) point b. B) point h. C) point f. D) point d. E) point e.
Economics
In the above figure, assuming Firm 1 and Firm 2 are the sole producers in the industry, the industry quantity supplied at price P2 is equal to
A) Q1 + Q2. B) Q1 + Q3. C) Q2 + Q4. D) Q4 - Q2.
Economics
If a tax on each Snicker's bar is $0.10, that tax is a
a. property tax b. customs duty c. progressive tax d. unit tax e. sales tax
Economics