The following graph shows the populations of the metropolitan areas of City X and City Y over six years. 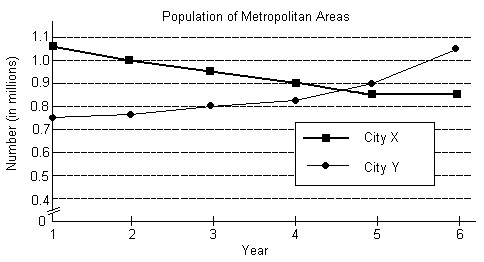 If equations of the form y = f(t) were determined that modeled either of the two graphs, then the variable t would represent
  and the variable y would represent
  .
.
A. City Y; City X
B. year; population (in millions)
C. population (in millions); year
D. City X; City Y
Answer: B
You might also like to view...
Find the standard equation of a parabola with the given focus or directrix. Assume that the vertex is at the origin.Directrix y = -8
A. y2 = 32x B. x2 = -8y C. x2 = 32y D. x = 32y2
Use the ratio test to determine if the series converges or diverges.
A. Converges B. Diverges
Solve the problem.The function f(t) = -0.15t2 + 0.49t + 31.7 models a certain country's population in millions, ages 65 and older, where t represents years after 2010. The function g(t) = 0.56t2 + 12.55t + 105.7 models the total yearly cost of the government's health insurance program in billions of dollars, where t represents years after 2010. What does the function  represent? Find
  (15).
(15).
A. Cost per person in thousands of dollars. $79.24 thousand B. Cost per person in thousands of dollars. $0.01 thousand C. Cost per person in thousands of dollars. $0.17 thousand D. Cost per person in thousands of dollars. $7.65 thousand
Convert the units using unit fractions.56 qt =  gal
gal
A. 56 B. 28 C. 112 D. 14