The MP curve represents
A) the Fed's monetary policy actions in setting a target for the federal funds rate.
B) the relationship between the money supply and the price level.
C) a relationship between the real interest rate and manufacturing production.
D) the relationship between real interest rates and potential GDP.
A
You might also like to view...
Use the following table to answer the next question.YearUnemployment Rate (%)Inflation Rate (%)14.03.024.52.535.02.045.53.055.02.5Based on this data, we can conclude ________.
A. the Phillips Curve model is wrong B. the Phillips Curve model cannot be evaluated C. the Phillips Curve model is correct D. the Phillips Curve model is sometimes correct, but does not account for all events
The average productivity of capital is defined as the ratio of total capital employed to the total output produced
a. the extra output produced by employing one more unit of capital while holding other inputs constant. b. the extra output produced by employing one more unit of capital while allowing other inputs to vary. c. the ratio of total output produced to the quantity of capital employed. d.
In 2010, in order to stimulate capital investment, President Obama proposed
a. a reduction in real interest rates. b. an increase in the money supply. c. increased write-offs for businesses purchasing equipment. d. an increase in the tax on capital gains.
In the graph showing an increase in aggregate demand, a drop of 3 percentage points in unemployment corresponds with ______.
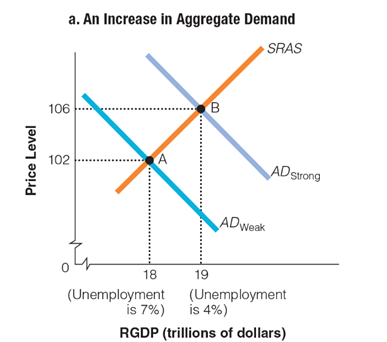
a. a decrease in aggregate demand
b. a price level increase of 4
c. an increase in RGDP of $4 trillion
d. a decrease in RGDP of $19 trillion