Solve the problem.The graph shows the median weight of girls between the ages of 0 and 24 months. 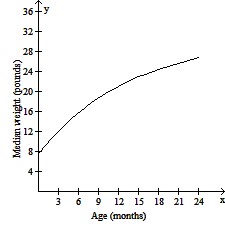 Use the graph to find the average growth rate of a typical girl between ages 12 and 15 months. Give your answer in pounds per month.
A. 1.5 lb/month
B. 0.6 lb/month
C. 0.5 lb/month
D. 1.0 lb/month
Answer: B
You might also like to view...
Solve.The bar graph shows the median annual income for residents of a selected region of the United States, by level of education. The given polynomial models describe the median annual income for men, M, and for women, W, who have completed x years of education.M = -23x3 + 1170x2 - 13,808x + 72,566W = 8x3 - 56x2 + 511x + 14,763Find a mathematical model for M - W and use it to calculate the difference in the median annual income between men and women with 14 years of education. Does the model underestimate or overestimate the actual difference?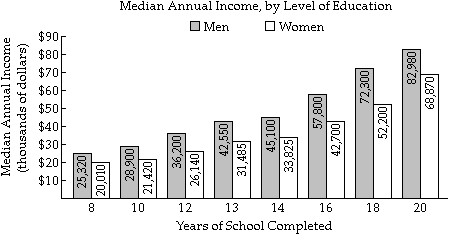
A. $12,569; overestimates B. $11,259; underestimates C. $26,877; overestimates D. $9383; underestimates
Expand the quotient by partial fractions.
A.  +
+ 
B.  +
+ 
C.  +
+ 
D.  +
+ 
Solve the problem.The table shows the number of college students who prefer a given pizza topping.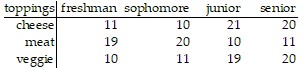 Find the empirical probability that a randomly selected student prefers meat toppings.
A. 0.104 B. 0.330 C. 0.341 D. 0.317
Integrate the given expression.
A.  x3 - 8x2 - 24x + C
B. 8x - 10 + C
C. 4x3 - 10x2 - 24x + C
D.  x3 - 5x2 - 24x + C