Use the given table or graph to write the inequality described.The sales figures for the Big "D" Company area shown below in a line plot.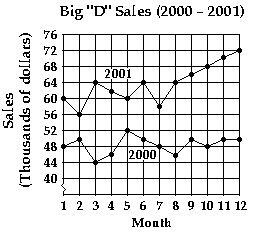 Use an inequality to compare the sales for July 2000 and July 2001.
A. $64,000 > $50,000
B. $48,000 < $58,000
C. $50,000 < $64,000
D. $46,000 < $64,000
Answer: B
Mathematics
You might also like to view...
Find the extreme values of the function and where they occur.y = 
A. Absolute maximum is -  at x = 0; absolute minimum is
  at x = -2.
B. Absolute maximum is  at x = 0; absolute minimum is -
  at x = -2.
C. None
D. Absolute maximum is 2 at x = 0; absolute minimum is  at x = -2.
Mathematics
Use the table to find the instantaneous velocity of y at the specified value of x.x = 2.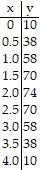
A. -8 B. 4 C. 0 D. 8
Mathematics
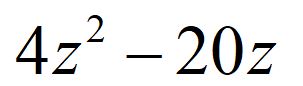
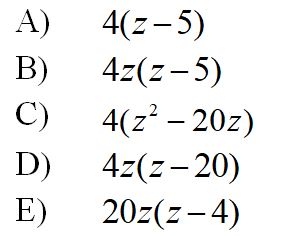
Factor:
Mathematics
Solve the problem.Students at Maple School earned $374 selling candles. They want to accumulate  for a club trip. What percent of their goal has been reached?
A. 5% B. 18.7% C. 50% D. .187%
Mathematics