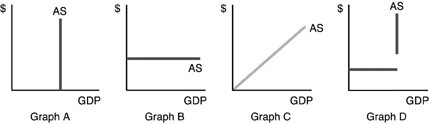
 Refer to the above figure. Which of the graphs is consistent with the long-run aggregate supply curve?
A. Graph A
B. Graph B
C. Graph C
D. Graph D
Answer: A
You might also like to view...
Dole Co operates in a monopolistically competitive market. To try to earn an economic profit, Dole Co will
A) prevent other firms from entering the market. B) increase its product's price. C) continually seek to differentiate its product. D) increase output.
The "kinked" oligopoly demand curve is a result of the assumption by an oligopolist that:
a. price increases will be matched, but price reductions will not. b. price increases will not be matched, but price reductions will. c. both price increases and price reductions will be matched. d. neither price increases, nor price reductions will be matched.
Without money, the process of acquiring goods and services would be much more efficient.
Answer the following statement true (T) or false (F)
Suppose the economy is self-regulating, the price level is 120, the quantity demanded of Real GDP and the quantity supplied of Real GDP in the short run both equal $5.7 trillion, and the quantity supplied of Real GDP in the long run is $5.2 trillion. Given all of this information, we can conclude that the economy ____________ in short run equilibrium, and that the price level in long run
equilibrium will be _____________ than 120. A) is not; less B) is; greater C) is; less D) is not; greater