According to the above figure, then the supply curve will
A) shift from S1 to S2.
B) shift from S2 to S1.
C) remain at S1.
D) shift either to the left or the right, but it is impossible to say without more information.
A
You might also like to view...
Capacity utilization increases. What is the impact on aggregate expenditures and income?
A) Both increase. B) Both decrease. C) Aggregate expenditure increases and income decreases. D) Aggregate expenditure decreases and income increases.
If full employment GDP is $500 billion greater than equilibrium GDP and there is a deflationary gap of $100 billion, how much is the multiplier?
What will be an ideal response?
Suppose that in a population of 50 million persons, 40 million are in the labor force, 36 million are employed, 2 million are classified as unable to work, and 1 million are classified as unwilling to work. The unemployment rate is
A. 72.0 percent. B. 8.0 percent. C. 10.0 percent. D. 80.0 percent.
Refer to the information provided in Figure 2.4 below to answer the question(s) that follow.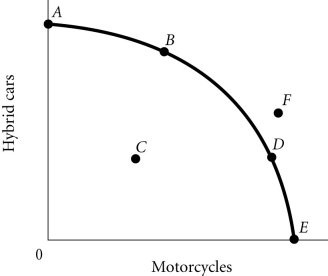 Figure 2.4According to Figure 2.4, Point E necessarily represents
A. only motorcycles being produced. B. overallocation of resources. C. an impossible production point. D. technological advancement.