Refer to the figure below.________ inflation will eventually move the economy pictured in the diagram from short-run equilibrium at point ________ to long-run equilibrium at point ________, 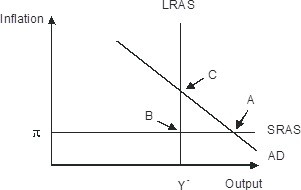
A. Rising; B; C
B. Falling; A; C
C. Falling; A; B
D. Rising; A; C
Answer: D
You might also like to view...
The Heckscher-Olin model uses differences in factor abundance to determine whether any nation has a comparative advantage in any good
a. True b. False Indicate whether the statement is true or false
When crowding out occurs, higher government spending results in higher interest rates, which in turn results in:
A. higher inflation. B. less consumption and investment. C. a larger debt ceiling. D. more tax revenues.
Refer to the information provided in Figure 24.1 below to answer the question(s) that follow.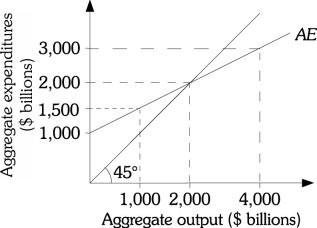 Figure 24.1Refer to Figure 24.1. Suppose that the consumption function is C = 300 + 0.5Yd and taxes are $300 billion, at equilibrium the value of autonomous consumption is
A. $400 billion. B. $300 billion. C. $200 billion. D. $100 billion.
Stabilization policy refers to the use of:
A. only fiscal policy. B. policy to shift the long-run aggregate supply curve. C. either fiscal or monetary policy. D. only monetary policy.