Use a graphing calculator to plot the data and find the quadratic function of best fit.A rock is dropped from a tall building and its distance (in feet) below the point of release is recorded as accurately as possible at various times after the moment of release. The results are shown in the table. Find the regression equation of the best model. 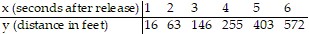
A. y = 13.0 e0.686x
B. y = -74.9 + 290 lnx
C. y = 15.95x2
D. y = - 148.4 + 112x
Answer: C
You might also like to view...
Find the domain and range.{(-2, 9), (-1, 6), (0, 5), (1, 6), (3, 14)}
A. domain: {9, 6, 5, 14}; range: {-2, -1, 1, 3} B. domain: {-2, -1, 0, 1, 3}; range: {9, 6, 5, 14} C. domain: {-2, -1, 1, 3}; range: {9, 6, 5, 14} D. domain: {9, 6, 5, 14}; range: {-2, -1, 0, 1, 3}
Graph the function y = g(x), given the graph of y = f(x). g(x) =  f(x - 1) + 3
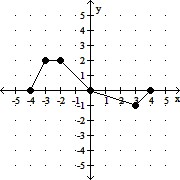

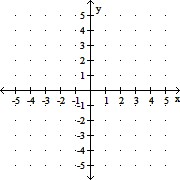
A. 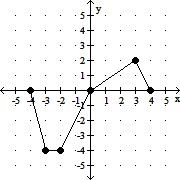
B. 
C. 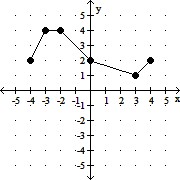
D. 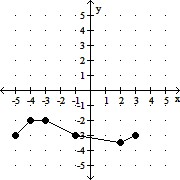
Use the relationship src="https://sciemce.com/media/3/ppg__cognero__Section_11.1_The_Three_Dimensional_Coordinate_System__media__aba17dbb-e564-4805-af3e-4b5625a7dd0e.PNG" class="wirisformula" align="middle" style="vertical-align: middle;" data-wiris-created="true" varid="variable_id_field" variablename="impvar_ae966adb86ec482abdf557df9" />, respectively.  to find the coordinates of the endpoint of a line segment if the coordinates of the other endpoint and the midpoint are
  and
and
?
A. 
B. 
C. 
D. 
E. 
Find the open interval(s) where the function is changing as requested.Increasing; y = x4 - 18x2 + 81
A. (-3, 0) B. (-3, 3) C. (-?, 0) D. (-3, 0), (3, ?)