Solve the problem.Suppose that the speed of a car, measured in miles per hour (mph), is monitored for some short period of time after the driver applies the brakes. The following table and graph relate the speed of the car to the amount of time, measured in seconds (sec), elapsed from the moment that the brakes are applied.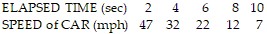
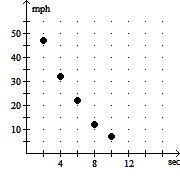 Is the slope of the graph positive or negative and is the slope constant, or does it change over time?
A. Positive, changes over time
B. Negative, changes over time
C. Positive, constant
D. Negative, constant
Answer: B
You might also like to view...
Use the shell method to find the volume of the solid generated by revolving the region bounded by the given curves and lines about the x-axis.y = 4 , y = 4
A.  ?
?
B.  ?
?
C.  ?
?
D.  ?
?
Solve the problem by integration.Under specified conditions, the time t (in min) required to form x grams of a substance during a chemical reaction is given by  Find the equation relating t and x if x = 0 g when
A. t =  ln
ln  +
+  ln
ln 
B. t =  ln
ln  -
-  ln 4
ln 4
C. t =  ln
ln  -
-  ln
ln 
D. t =  ln
ln  +
+  ln 4
ln 4
The table below shows the number N of persons injured per 100 accident-involved vehicles when the accident speed was s miles per hour. s 20 30 40 50 60 N 28 34 38 46 71? A: Use exponential regression to model N as a function of s. Round your answer to two decimal places.B: Plot the exponential model along with the data points.C: Do the data show that accidents at speeds of 60 miles per hour are more dangerous or less dangerous than predicted by the model?
What will be an ideal response?
Determine whether the set is well defined or not well defined. The set of the best doctors
A. well defined B. not well defined