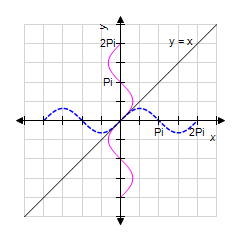
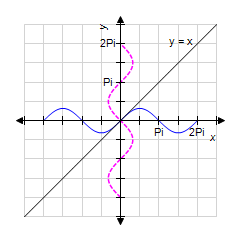
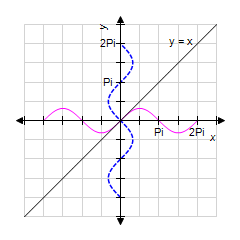
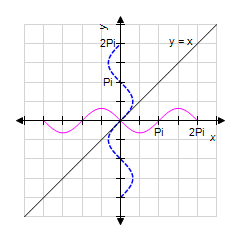
Graph  between -2? and 2?, and then reflect the graph about the line y = x to obtain the graph of
  .
.
?
A. ?
B. ?
C. ?
D. ?
E. ?
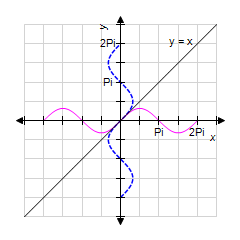
Answer: E
You might also like to view...
Suppose u and v are differentiable functions of x. Use the given values of the functions and their derivatives to find the value of the indicated derivative.u(1) = 3, u '(1) = -6, v(1) = 6, v '(1) = -2. (2u - 4v) at x = 1
A. 30 B. -18 C. -20 D. -4
Use the product rule to simplify.
A. x4
B. x14
C. x7
D. x3
Plot the point.(3, 5)
A. 
B. 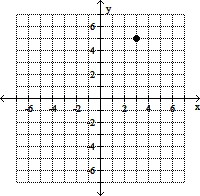
C. 
D. 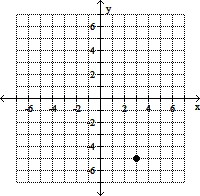
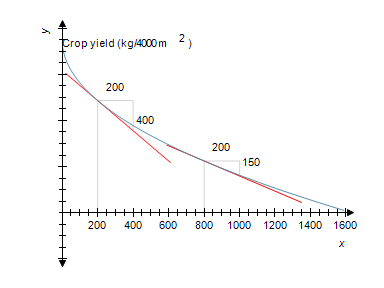
Productivity and yield of cultivated crops are often reduced by insect pests. The following graph shows the relationship between the yield of a certain crop, f(x), as a function of the density of aphids x. (Aphids are small insects that suck plant juices.) Here, f(x) is measured in kilograms/ 4,000 square meters, and x is measured in hundreds of aphids/bean stem. By computing the slopes of the respective tangent lines, estimate the rate of change of the crop yield with respect to the density of aphids when that density is 200 aphids/bean stem and when it is 800 aphids/bean stem.
?
?
A. - 0.5 when it is 200 aphids/bean stem,- 1.333 when it is 800 aphids/bean stem
B. 00.5 when it is 200 aphids/bean stem,01.333 when it is 800 aphids/bean stem
C. 02 when it is 200 aphids/bean stem,00.75 when it is 800 aphids/bean stem
D. - 2 when it is 200 aphids/bean stem,- 0.75 when it is 800 aphids/bean stem