Use a graphing utility to graph the function over the indicated interval and approximate any local maxima and local minima. Determine where the function is increasing and where it is decreasing. If necessary, round answers to two decimal places.f(x) = -0.3x3 + 0.2x2 + 4x - 5; (-4, 5)
What will be an ideal response?
local maximum at (2.34, 1.61)
local minimum at (-1.9, -9.82)
increasing on (-1.9, 2.34)
decreasing on (-4, -1.9) and (2.34, 5)
You might also like to view...
Divide. Write the answer in simplest form. ÷ 1
÷ 1
A. 
B. 1
C. 
D. 
Find the intercepts and graph.5x - 20y = 20
A. 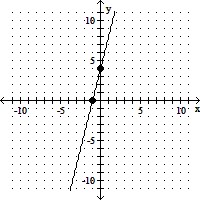
B. 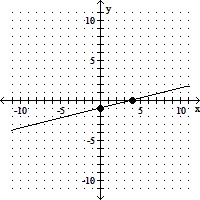
C. 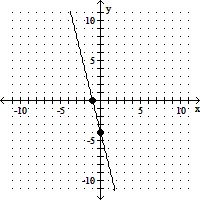
D. 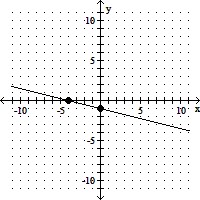
Solve the problem.S(x) = -x3 - 3x2 + 72x + 900, x ? 2 is an approximation to the number of salmon swimming upstream to spawn, where x represents the water temperature in degrees Celsius. Find the temperature that produces the maximum number of salmon.
A. 6°C B. 8°C C. 4°C D. 2°C
What percent of the total population is found between the mean and the z-score? Round your answer to two decimal places.
Standard Normal Distribution; z-scores z 0.00 0.01 0.02 0.03 0.04 0.05 0.06 0.07 0.08 0.090.0 0.0000 0.0040 0.0080 0.0120 0.0160 0.0199 0.0239 0.0279 0.0319 0.03590.1 0.0398 0.0438 0.0478 0.0517 0.0557 0.0596 0.0636 0.0675 0.0714 0.07530.2 0.0793 0.0832 0.0871 0.0910 0.0948 0.0987 0.1026 0.1064 0.1103 0.11410.3 0.1179 0.1217 0.1255 0.1293 0.1331 0.1368 0.1406 0.1443 0.1480 0.15170.4 0.1554 0.1591 0.1628 0.1664 0.1700 0.1736 0.1772 0.1808 0.1844 0.18790.5 0.1915 0.1950 0.1985 0.2019 0.2054 0.2088 0.2123 0.2157 0.2190 0.22240.6 0.2257 0.2291 0.2324 0.2357 0.2389 0.2422 0.2454 0.2486 0.2517 0.25490.7 0.2580 0.2611 0.2642 0.2673 0.2704 0.2734 0.2764 0.2794 0.2823 0.28520.8 0.2881 0.2910 0.2939 0.2967 0.2995 0.3023 0.3051 0.3078 0.3106 0.31330.9 0.3159 0.3186 0.3212 0.3238 0.3264 0.3289 0.3315 0.3340 0.3365 0.33891.0 0.3413 0.3438 0.3461 0.3485 0.3508 0.3531 0.3554 0.3577 0.3599 0.3621? __________% Fill in the blank(s) with the appropriate word(s).