Refer to Figure 1. The figure represents a circular-flow diagram. Boxes A and B represent
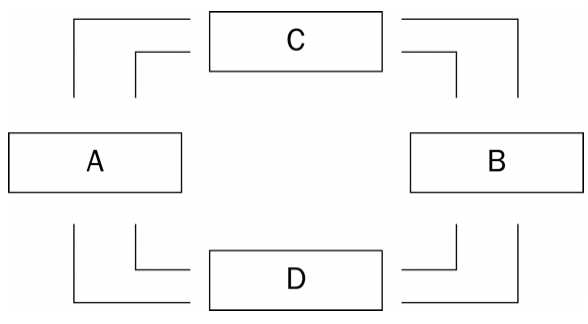
a. firms and households.
b. households and government.
c. the markets for goods and services and the financial markets.
d. the markets for goods and the markets for services
Answer: a. firms and households.
You might also like to view...
Suppose a 10 percent increase in the price of textbooks decreases the quantity demanded by 20 percent. The elasticity of demand for textbooks is
A) 0.2. B) 2.0. C) 5.0. D) 10.0.
The tax multiplier is greater than the spending multiplier regardless of the value of the marginal propensity to consume (MPC)
a. True b. False Indicate whether the statement is true or false
During a recession, government deficits can grow because:
A. government spending often increases as part of an expansionary fiscal policy. B. income tax revenues tend to decrease because people are earning less. C. sales tax revenues tend to decrease because people are spending less. D. All of these are true.
A firm has positive fixed cost and positive variable cost. At its current level of output, marginal cost equals average cost. The firm must
a. not be producing at its profit-maximizing level of output. b. be producing the quantity that minimizes average cost. c. be operating at a point at which total variable cost equals total fixed cost. d. be earning negative profit.