Represent the following with a graph.Create a graph that models the bordering relationship among the states shown in the map. Use vertices to represent the states and edges to represent common borders.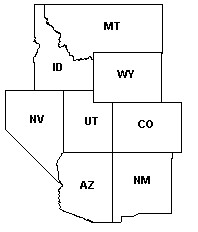
A. 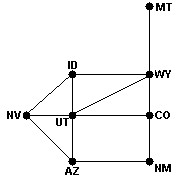
B. 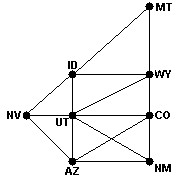
C. 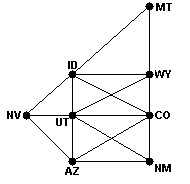
D. 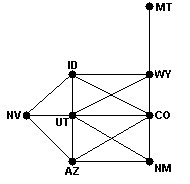
Answer: B
Mathematics
You might also like to view...
Find the median for the given sample data.2, 12, 16, 21, 30, 30, 49Find the median for the data.
A. 16 B. 25.5 C. 30 D. 21
Mathematics
Count the number of items asked for in the problem.Triangles (of any size)
A. 16 B. 15 C. 13 D. 19
Mathematics
Solve the problem.A fair coin is tossed three times. Which of the following describes the sample space for this random experiment?
A. {3 H's, 2 H's and 1 T, 1 H and 2 T's, 3 T's} B. {HHH, HHT, HTH, THH, HTT, THT, TTH, TTT} C. {HHH, TTT} D. {H, T} E. none of these
Mathematics
Solve the problem.The table gives the change in producer price indexes. Which has a greater absolute value, the change for food from January to June or from July to December?
A. July to December B. January to June
Mathematics