This graph demonstrates the domestic demand and supply for a good, as well as the world price for that good.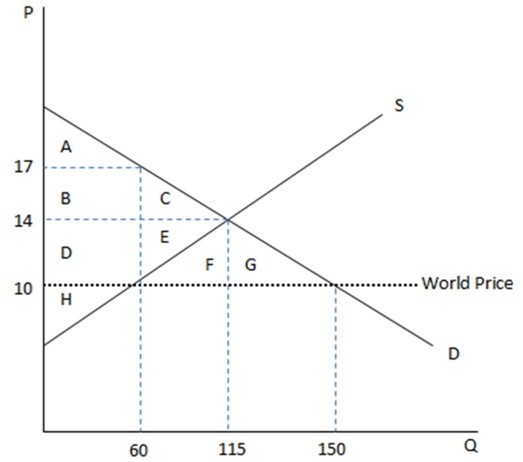 According to the graph shown, if this were depicting an autarky, the amount being sold domestically is:
A. 115.
B. 90.
C. 60.
D. 160.
Answer: A
You might also like to view...
Which of the following statements is true?
A) An increase in potential GDP increases aggregate supply and shifts the AS curve leftward. B) A decrease in potential GDP decreases aggregate supply and shifts the AS curve leftward. C) An increase in the money wage rate shifts the AS curve rightward. D) A fall in the price level shifts the AS curve leftward. E) An increase in the money wage rate increases potential GDP.
Consider the same market for nonalcoholic beer as in the previous question. Cudweiser's response function is
a. QB = 2,000 ? .5QC b. QB = 1,500 ? .5QC c. QC = 2,000 ? .5QB d. QC = 1,500 ? .5QB
From the standpoint of the economy as a whole, the role of insurance is
a. to entice risk-loving people to become risk averse. b. to promote the phenomenon of adverse selection. c. not to eliminate the risks inherent in life, but to spread them around more efficiently. d. not to spread risks, but to eliminate them for individual policy holders.
Which of the following is a Keynesian approach for dealing with a recession?
A. Raise taxes. B. Raise interest rates. C. Increase supply incentives for producers. D. Increase government expenditure.