The graph of 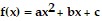 is given in the figure. State whether
  or
or 

A. a > 0
B. a < 0
Answer: B
Mathematics
You might also like to view...
Estimate the indicated probability.The table shows the number of college students who prefer a given pizza topping.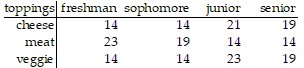 Determine the empirical probability that a junior prefers meat toppings. Round to the nearest thousandth.
A. 0.319 B. 0.200 C. 0.067 D. 0.241
Mathematics
Identify the group of terms as like or unlike.8, 15, -12
A. Like B. Unlike
Mathematics
Convert the mass as indicated.24.6 grams to kilograms
A. 0.00246 kg B. 2460 kg C. 0.0246 kg D. 24,600 kg
Mathematics
Solve the logarithmic equation symbolically.ln x + ln x8 = 9
A. x = 
B. x + x8 = e9
C. x = e9/8
D. x = e
Mathematics