A biology class performs an experiment comparing the quantity of food consumed by a certain kind of moth with the quantity supplied. The model for the experimental data is given by
?
?
?
where x is the quantity (in milligrams) of food supplied and y is the quantity (in milligrams) of food consumed.
Select the correct graph of this model.
?
A. ?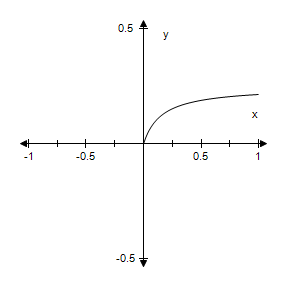
B. ?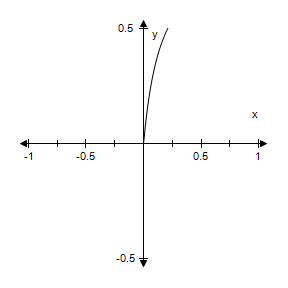
C. ?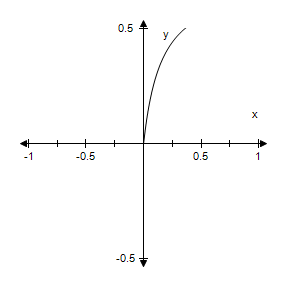
D. ?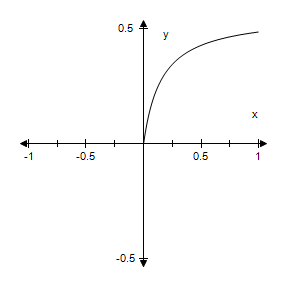
E. ? 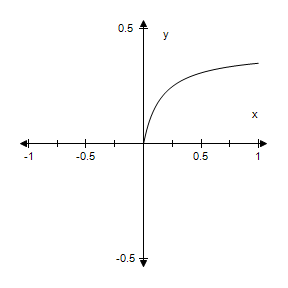
Answer: A
Mathematics
You might also like to view...
Plot the given points and sketch the line that passes through them.(-9, 8) and (-9, -7)
A. 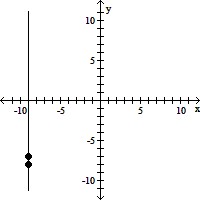
B. 
C. 
D. 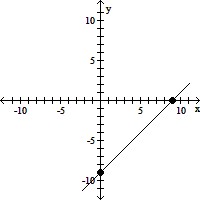
Mathematics
Simplify the expression. Assume that all variables are positive.
A. 
B. 
C. 4
D. 
Mathematics
Graph the equation as a solid line. Graph the inverse relation as a dashed line on the same axes by reflecting across the line y = x.x = 4

A. 
B. 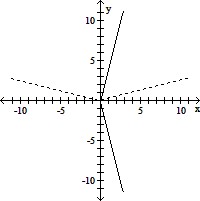
C. 
D. 
Mathematics
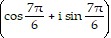
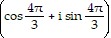
Find the polar form of the complex number.-4 - 4i
- 4i
A. 8
B. 4
C. 4
D. 8
Mathematics