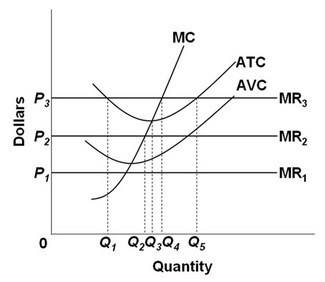
 Refer to the above diagram. All data are for the short run. Which of the following statements is correct?
A. At price P1, the firm will close down.
B. Production is profitable only when price is at P2.
C. Average fixed cost is P1P3 at output Q1.
D. The firm will produce an output of Q1 when price is P1.
Answer: A
You might also like to view...
The federal budget deficit becomes _____ during recessions because _____
a. smaller; transfer payments increase and tax revenues decline b. larger; transfer payments increase and tax revenues decline c. larger; both transfer payments and tax revenues increase d. smaller; both transfer payments and tax revenues increase e. smaller; both transfer payments and tax revenues decrease
The market supply curve for labor: a. shows the relationship between the wage rate and the number of employees firms are willing to hire
b. shows the relationship between the price of output and the number of employees firms are willing to hire. c. shows the relationship between the wage rate and the quantity of labor that workers are willing to supply. d. shows the relationship between the price of output and the quantity of labor that workers are willing to supply.
Suppose a woman has an exterminator treat her house every month but she then marries the exterminator who now performs the service for free. As a result, GDP would
a. increase b. decrease c. not change, because services are not counted in the first place d. not change, as the activity occurred monthly e. not change, because the activity is an intermediate good or service
Tim is offered two gambles. With gamble A, he either gains $2 or loses $1 with a 50 percent probability. With gamble B, he either gains $3 or loses $2 with a 50 percent probability. Tim prefers gamble B to gamble A. What can we conclude?
A. Tim is risk neutral. B. Tim is risk loving. C. Tim is risk averse. D. Insufficient information to determine.