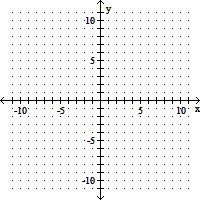
The following table shows enrollment E at your university t years after 2010.
t 0 1 2 3 E 7017 7251 7485 7719A: Complete a table of changes to show that the data are linear.B: Find a linear model for the data.C: If this trend persists, what enrollment do you anticipate in 2017?
What will be an ideal response?
A
| Change in t | From 0 to 1 | From 1 to 2 | From 2 to 3 |
| Change in E | 234 | 234 | 234 |
?
B:
C: 8655
Mathematics
You might also like to view...
Simplify the expression. ?
?  +
+  ?
? 
A. 
B. 
C. 
D. 
Mathematics
Use both properties of equality to solve the equation.-32 = 5x + 3
A. -40 B. -7 C. 9 D. -36
Mathematics
Find the solution set of the system by graphing the equations by hand. If the system is inconsistent or dependent, say so.y = 3x + 3y = -2x - 7
A. (-2, -2) B. (2, 3) C. (-2, -3) D. (-2, 3)
Mathematics
Factor the polynomial.18prs2 - 6pst + 8pr2st
A. 2ps2(9r - 3t + 4r2t) B. 2ps(9rs - 3t + 4r2t) C. 2prs(9s - 3t + 4rt) D. 2ps(9rs - 6t + 8r2t)
Mathematics
