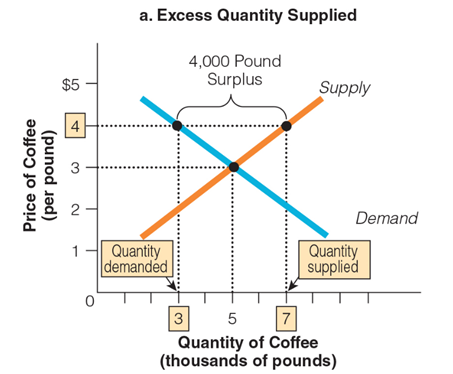
What does the graph point at the intersection of $4 per pound and 7,000 pounds of coffee show?
a. an excess of quantity demanded
b. a shortage of quantity supplied
c. an equilibrium point
d. a surplus of quantity supplied
d. a surplus of quantity supplied
You might also like to view...
The above figures show the market for gasoline. Which figure shows the effect of motorists increasing the number of times they take the bus to work rather than driving their own cars?
A) Figure A B) Figure B C) Figure C D) Figure D
According to the National Bureau of Economic Research, the "two most reliable comprehensive estimates of aggregate domestic production" are ________ when dating the beginning and ending of recessions
A) the level of employment and monthly payroll data B) industrial production and wholesale and retail sales C) gross domestic product and gross domestic income D) real manufacturing production and the natural rate of unemployment
If a firm in a monopolistically competitive market has a demand curve shifting to the right, it is likely that:
A. positive economic profits are being earned. B. firms are entering the market. C. the selling price is less than the average total cost of the firm. D. All of these statements are true.
For this question, assume that expectations of productivity are slow to adjust. Further assume that A had been increasing by 2% a year. Now suppose that A increases by 5% in period t. This increase in productivity growth will cause
A) the real wage to rise and no change in the natural rate of unemployment. B) the WS relation to shift up more than the PS relation. C) the natural rate of unemployment to fall. D) the real wage to fall.