Use interval notation to express the inequality shown in the graph.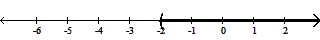
A. (-?, -2]
B. (-?, -2)
C. (-2, ?)
D. [-2, ?)
Answer: C
You might also like to view...
Evaluate the function for the indicated input and interpret the result.The table lists the number of persons voting in an election by election year and sex, for a small community.  Let this table be a partial numerical representation of a function f, where
  computes the number of persons who voted in the year x whose sex is y. Evaluate
  Interpret the result.
A. f (1976, Male) = 971 The number of males who voted in 1976 was 971. B. f (1976, Male) = 964 The number of males who voted in 1976 was 964. C. f (1976, Male) = 836 The number of males who voted in 1976 was 937. D. f (1976, Male) = 971 The number of people who voted in 1976 was 971, all male.
State whether the equation is linear or quadratic.4x + 9 = -7
A. quadratic B. linear
Determine whether the graph is the graph of a function.
A. yes B. no
Solve.A company has 63,000 employees. Of these,  drive alone to work,
  car pool,
  use public transportation,
  cycle, and the remainder use other methods of transportation. How many employees use each method of transportation?
A. Drive alone: 2,100; car pool: 10,500; public transportation: 9,000; cycle: 7,000; 
B. Drive alone: 21,000; car pool: 10,500; public transportation: 9,000; cycle: 7,000; 
C. Drive alone: 21,100; car pool: 10,500; public transportation: 8,900; cycle: 7,000; other: 1000
D. Drive alone: 21,000; car pool: 10,500; public transportation: 9,000; cycle: 7,000; 