The graph shown portrays a subsidy to buyers. Once the subsidy is in place, the buyers pay _____ and the sellers receive ________; the difference is ___________.
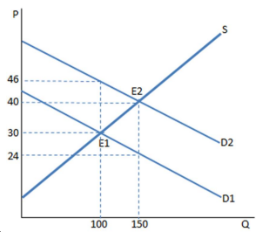
A. $24; $40; the amount of the subsidy
B. $30; $46; the amount of the subsidy
C. $40; $24; the amount of the subsidy
D. $24; $40; the amount of government revenue
A. $24; $40; the amount of the subsidy
You might also like to view...
Explain how an increase in the public's taste towards less leisure would affect the labor market, the production function, and aggregate output. Provide graphs to illustrate
What will be an ideal response?
The unemployment rate will increase whenever there is a(n):
A. increase in the number of persons classified as unemployed. B. increase in the number of unemployed persons relative to the size of the labor force. C. increase in the size of the U.S. population and there is no change in the number of persons classified as employed. D. reduction in the size of the labor force.
What fraction of the world's population lives on no more than $2 a day?
A. 1/10 B. 1/4 C. 1/2 D. 3/4
"Unlike a monopoly, consumer surplus in a perfectly competitive market is zero." Do you agree or disagree? Why?
What will be an ideal response?