Refer to the diagram of the market for product X. Curve S t embodies all costs (including externalities) and D t embodies all benefits (including externalities) associated with the production and consumption of X. Assuming the market equilibrium output
is Q 1 , we can conclude that the existence of external:
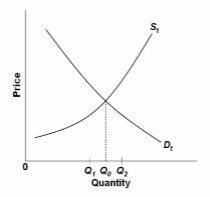
A. costs has resulted in an overallocation of resources to X.
B. benefits has resulted in an overallocation of resources to X.
C. costs has resulted in an underallocation of resources to X.
D. benefits has resulted in an underallocation of resources to X.
D. benefits has resulted in an underallocation of resources to X.
You might also like to view...
Consider the perfectly competitive firm in the above figure. The profit maximizing level of output for the firm is equal to
A) 0 units. B) 14 units. C) 17 units. D) 19 units.
During the financial crisis of 2007-09, the prices of U.S. Treasury securities
A) rose and the price of corporate bonds declined. B) fell relative to the prices of corporate bonds. C) remained in the same relative position to the prices of corporate bonds. D) were frozen by order of the federal government.
Refer to the table below. If this market is a Cournot Oligopoly and Firm X is produces 50 units, what is Firm Y's demand at a price of $70?
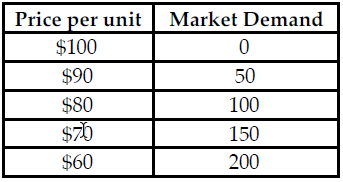
The table above shows the market demand for a product that both Firm X and Firm Y manufacture. Both firms produce an identical product and the firms' average total and marginal cost are equal and constant.
A) 50
B) 0
C) 100
D) 150
Cashing out capital gains in Virtual Currency System #3 (i.e., turning virtual capital gains into real world currencies) causes the nation's:
a. Monetary base to remain the same. b. M2 money supply to fall. c. M2 money multiplier to fall. d. M2 money supply to rise.