Provide an appropriate response.A visual aid that is divided into two or more sections to illustrate how partial data relates to the whole is a:
A. circle graph
B. line graph
C. bar graph
D. range graph
Answer: A
Mathematics
You might also like to view...
Solve the problem.Let D be the smaller cap cut from a solid ball of radius 8 units by a plane 4 units from the center of the sphere. Set up the triple integral for the volume of D in rectangular coordinates.
A. 
B. 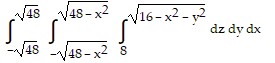
C. 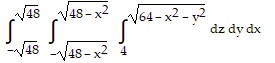
D. 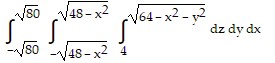
Mathematics
Graph the inequality.x - y > -3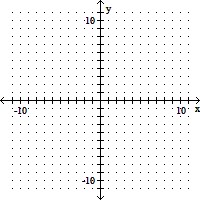
A. 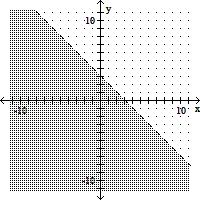
B. 
C. 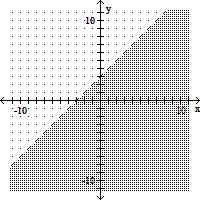
D. 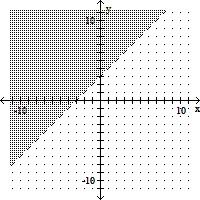
Mathematics
What is the sine of angle é?

a. c/b
b. b/c
c. a/c
d. a/b
e. b/a
Mathematics
In which quadrant is the point (-7, -3) located on a rectangular coordinate system?
a. I b. II c. III d. IV
Mathematics