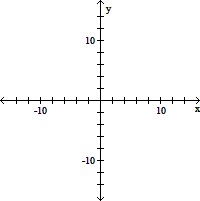
Graph the rational function.f(x) = 

A. 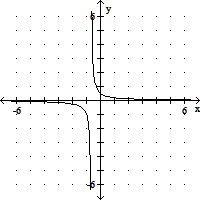
B. 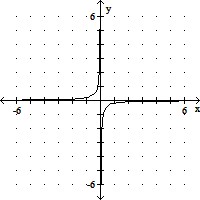
C. 
D. 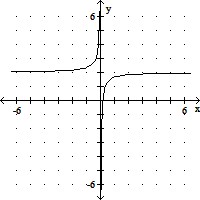
Answer: C
You might also like to view...
Graph the function using transformations.f(x) = 5 - 
A. 
B. 
C. 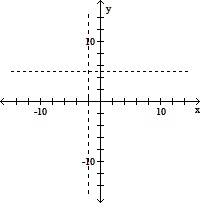
D. 
Use an ordered pair to identify each point on the given coordinate plane. State the quadrant or axis where each point lies.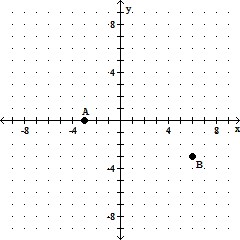
A. A(-3, 0) on the x-axis; B(6, -3) in Quadrant IV B. A(-3, 0) on the y-axis; B(-6, -3) in Quadrant III C. A(-3, 3) in Quadrant II; B(6, -3) in Quadrant IV D. A(3, 0) on the x-axis; B(6, -3) in Quadrant IV
Graph the list of numbers on the given number line.0,  , 2
, 2 , 3
, 3 , 6
, 6![]()
A.
3 ? ? | 2 ? ? |  |
B.
3 ? ? | 2 ? ? |  |
C.
 ? ? | 2 ? ? | 3 |
D.
 ? ? | 2 ? ? | 3 |
Pollution levels in Lake Erie have been modeled by the equation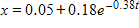 , where x is the volume of pollutants (in cubic kilometers) and t is the time (in years) (Adapted from R. H. Rainey, Science 155 (1967), 1242-1243). Find the initial pollution level; that is, find x when
  .
?
.
?
A. 0.23 km3 B. 0.1 km3 C. 0.40 km3 D. 0.20 km3 E. 0.7 km3