?These two curves show ____.
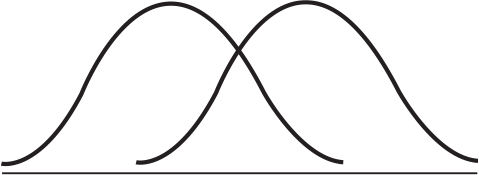
A. ?large differences in standard deviations
B. ?inconclusive evidence of similarity
C. ?skewed curves
D. ?standard normal curves
Answer: A
You might also like to view...
The best solution to air-duct leakage problems is _____.
a. manually sealing all leaks with duct tape b. keeping a nitrogen purge on the duct system c. properly sealing all ducts during installation d. adding insulation throughout the duct system
The upper control limitUCL is defined as:
a. the lowest point established as the bottom specification on a control chart. LCL X-bar = Average X-bar – (A2 X Average R). b. a term used on a Table designed to identify factors for Range control limits. c. are boundaries that tell you if the process is in control. d. the highest point established as the top specification on a control chart. UCL X-bar = Average X-bar + (A2 X Average R).
When measuring shaft runout, a dial indicator produces readings between +0.0025 inches (positive) and -0.0055 inches (negative). What is the TIR?
A. 0.0025 inches B. 0.0055 inches C. 0.010 inches D. 0.008 inches
A(n) _____ is a mathematical statement in which both sides are equal to each other.?
A. formula? B. equation? C. fraction? D. expression?