Which trend is shown in this graph?
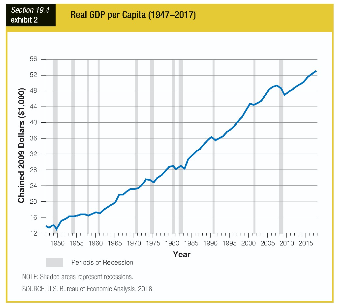
a. The real GDP per capita decreases from 1975 to 1983.
b. The real GDP per capita remains constant from 1969 to 1975.
c. The real GDP per capita increases from 2007 to 2009.
d. The real GDP per capita sharply increases from 1983 to 1991.
d. The real GDP per capita sharply increases from 1983 to 1991.
You might also like to view...
The gross domestic product of a country is $500,000. If its income per worker of the population is $100, the size of its employed labor force is ________
A) 5,000 B) 200 C) 8,000 D) 2,500
What is the "big tradeoff"?
What will be an ideal response?
In the accelerator theory the
A) smaller the desired capital-output ratio the larger will be net investment. B) smaller the desired capital-output ratio the larger will be replacement investment. C) larger the desired capital-output ratio the larger will be net investment. D) larger the desired capital-output ratio the smaller will be replacement investment.
Which of the following could lead to an increase in the equilibrium quantity of a good?
a. a decrease in supply and a decrease in demand b. an increase in the price of an input c. an increase in demand and an increase in supply d. a decrease in demand regardless of supply e. a decrease in technology