In the bar graphs below, a projection of population by age groups and gender for two different countries is given as a percent of the country's population at the time. Provide an appropriate response.Population Pyramids for Countries A and B: 2006 and 2050
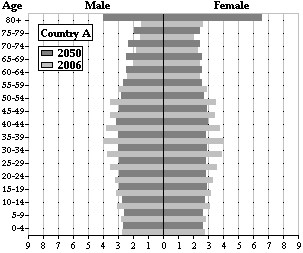
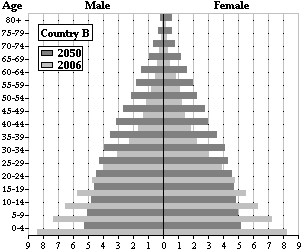 In 2006, which country had the largest portion of its population in the 0-4 age group, and what was that percent?
A. Country B with about 10.3%
B. Country B with about 16.7%
C. Country B with about 8.5%
D. Country A with about 5%
Answer: B
Mathematics
You might also like to view...
Solve the given trigonometric equation analytically (using identities when necessary for exact values when possible) for values of x for 0 ? x < 2?.sin2 x - cos2 x = 0
A.  ,
, 
B.  ,
, 
C.  ,
,  ,
,  ,
, 
D. 
Mathematics
Write the equation in slope-intercept form.5x - 7y = 4
A. y =  x +
x + 
B. y =  x +
x + 
C. y = 5x - 4
D. y =  x -
x - 
Mathematics
Provide an appropriate response.When graphing the inequality y ? x + 3, why is the point (1, 4) not a good choice for a test point?
What will be an ideal response?
Mathematics
Find the indicated matrix.Let A =  and B =
  . Find 4A + B.
A. 
B. 
C. 
D. 
Mathematics