A candlestick chart is a type of stockbar chart. The real body is displayed in different colors to indicate the action for that day. What does it mean if the real body is red?
A. The stock closed higher than the opening price.
B. The stock closed at the opening price.
C. The stock opened higher than the closing price.
D. The stock closed lower than the opening price.
Answer: D
Mathematics
You might also like to view...
Provide an appropriate response.Without actually solving each equation, determine which one of the following has 0 in its solution set. Explain your answer.p2 - 10p + 8 = 0a3 + 9a2 = 10a-7n - 7n - 9 = 036p2 - 9 = 0
What will be an ideal response?
Mathematics
Solve the inequality and graph the solution.m - 3(m + 7) < 5m![]()
A. (-3, ?)![]()
B. (-?, -3)![]()
C. (-?, 1)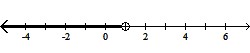
D. (1, ?)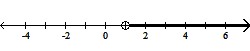
Mathematics
Round as indicated.5731 to the nearest hundred
A. 5700 B. 5800 C. 5710 D. 5600
Mathematics
Is the following correspondence a function??![]()
A. Yes B. No
Mathematics