Which graph in the above figure represents the isoquants where, as the amount of labor used increases and the amount of capital used decreases, the marginal product of labor rises when Capital per day is on the vertical axis and Labor per day is on
the horizontal axis? A) Graph A
B) Graph B
C) Graph C
D) Graph D
D
You might also like to view...
Workers in the United States receive significantly higher compensation than almost all other western European nations.
Answer the following statement true (T) or false (F)
If the production possibilities curves of two countries have the same slope,
a. neither has a comparative advantage, and there are no gains from trade. b. although there is no comparative advantage, there are potential gains if there are differences in absolute advantage. c. neither has an absolute advantage, and there cannot be gains from trade. d. both have an absolute advantage, and can gain from trade.
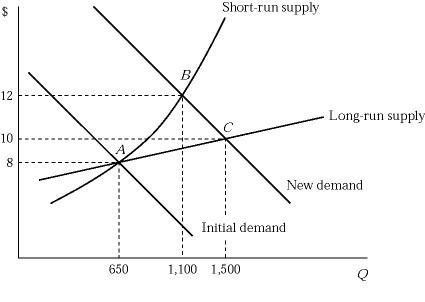
 Figure 6.5 shows the short-run and long-run effects of an increase in demand of an industry with increasing cost. The market is in equilibrium at point A, where 100 identical firms produce 6 units of a product per hour. If the market demand curve shifts to the right, what will happen to an individual firm's profit?
A. Each firm earns a positive profit at point B. B. Each firm earns a zero profit at point B because the market is perfectly competitive. C. The profit of each firm decreases as more firms enter the market and share the benefits of an increase in demand pushing the market from point A to point B. D. None of these
If the long-term labor force growth rate is 1.2% and the long-term productivity growth rate is 2.4%, then the
A. spending multiplier is 2. B. potential growth rate is 3.6%. C. real GDP per capita growth rate is 0.5%. D. short-term growth rate is 1.2%.