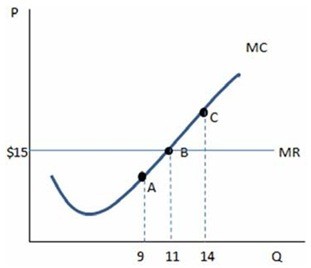
 According to the graph shown, the market price is:
A. $11
B. $15
C. $9
D. $20
Answer: B
You might also like to view...
According to the figure shown:
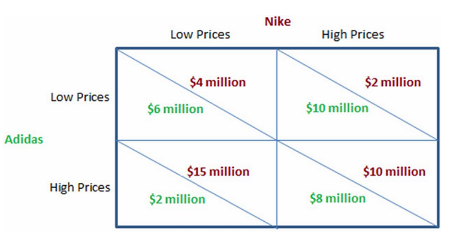
A. there is no stable equilibrium to the game.
B. both players will act in their own self-interest and get a stable, but less than optimum, equilibrium.
C. both players will act in their own self-interest and get an optimum equilibrium that is stable.
D. both players have an incentive to charge a low price and undercut the competition.
A good that is perfectly standardized is:
A. likely to be interchangeable with others in the market. B. indistinguishable to others in the market. C. fairly close to others in the market. D. determined to be the same by government.
More recently, the velocity of money was:
A. higher during the housing boom and lower during the recession that followed. B. lower during the housing boom and higher during the recession that followed. C. consistently higher than the historical trend since the mid-1980s. D. consistently lower than the historical trend since the early 1990s.
Average variable cost is
A. the difference between variable and fixed cost. B. the ratio of variable cost to total cost. C. the ratio of variable cost to fixed cost. D. the ratio of total variable cost to the quantity of output produced.