Use the following graph for a competitive market to answer the question below.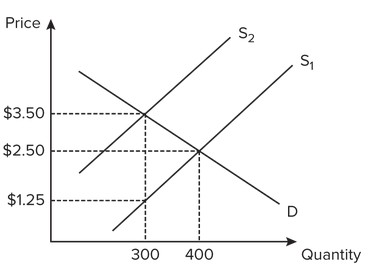 Assume the government imposes a $2.25 tax on suppliers, which results in a shift of the supply curve from S1 to S2. How much of the total tax revenue is paid by the buyer?
A. $675
B. $375
C. $750
D. $300
Answer: D
You might also like to view...
If it is a cultural norm to believe that "a busy person is an important person," then we would expect the labor:
A. supply in that culture to be relatively greater at any wage. B. demand in that culture to be relatively greater at any wage. C. supply in that culture to be relatively lower at any wage. D. demand in that culture to be relatively lower at any wage.
A safety report is released that contends that sport utility vehicles are more prone to roll over during crashes than was previously thought. At the same time, the price of steel (used to produce motor vehicles) increases. The net effect of these two incidents on the market for sport utility vehicles is a(n): a. decrease in price and an increase in equilibrium quantity
b. decrease in price and a decrease in equilibrium quantity. c. increase in price and a decrease in equilibrium quantity. d. indeterminate change in price and a decrease in equilibrium quantity.
The marginal propensity to consume is calculated by dividing the change in consumer spending by the change in disposable income.
Answer the following statement true (T) or false (F)
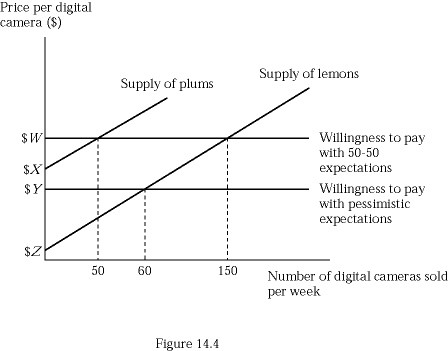 Figure 14.4 represents the market for used 12 megapixel digital cameras. Suppose buyers are willing to pay $400 for a plum (high-quality) used digital camera and $200 for a lemon (low-quality) used digital camera. If buyers believe that 50% of used digital cameras in the market are lemons (low quality), what is consumers' willingness to pay ($W)?
A. $100 B. $200 C. $300 D. $400