The following double-bar graph illustrates the revenue for a company for the four quarters of the year for two different years. Use the graph to answer the question.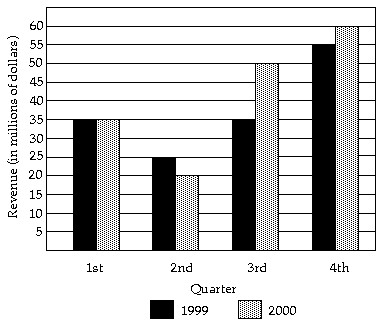 In what quarter was the revenue the greatest for 2000?
A. second quarter
B. fourth quarter
C. first quarter
D. third quarter
Answer: B
You might also like to view...
Tell whether the statement is true or false.{2, 16, 26, 9, 32} = {32, 16, 9, 62, 2}
A. True B. False
Find the quotient.
A. -320
B. -4
C. 4
D. 
Solve the problem.Suppose that the number of VCR's manufactured at a factory is given by  where t is the number of hours that the factory has been in operation. Suppose that the cost, in dollars, of producing n units is given by
  . Find and interpret
A. (C?N)(t) = 233 + 245t; This function gives the cost as a function of the number of hours that the factory is in operation. B. (C?N)(t) = 233 + 245t; This function gives the cost as a function of the number of of VCR's produced. C. (C?N)(t) = 233 + 245t; This function gives the number of hours that the factory is in operation as a function of cost. D. (C?N)(t) = 1165 - 245t; This function gives the cost as a function of the number of hours that the factory is in operation.
Solve the problem.Persons taking a 30-hour review course to prepare for a standardized exam average a score of 620 on that exam. Persons taking a 70-hour review course average a score of 772. Find a linear function, S(t), which fits this data, and which expresses score as a function of time. Use this function to predict an average score for persons taking a 51-hour review course. Round your answer to the tenths place.
A. 692.5 B. 713.8 C. 704.0 D. 699.8