Large amounts of quantitative data are difficult to analyze without some kind of organization. A table into which the data are sorted into 'classes' is called a
A. bar chart
B. bell curve
C. histogram
D. frequency distribution
Answer: D
Mathematics
You might also like to view...
Write the number in scientific notation.0.000286
A. 2.86 × 10⁴ B. 2.86 × 10⁻⁵ C. 2.86 × 10⁻⁴ D. 2.86 × 10⁻³
Mathematics
Solve the system of linear equations. 9x - 33 = -6y 3x - 3y = -9
A. (1, 5) B. (0, 5) C. (1, 4) D. No solutions
Mathematics
Solve the problem.Which of the following functions could have this graph? 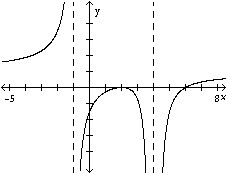
A. y = 
B. y = 
C. y = 
D. y = 
Mathematics
Factor.3x(6x + 5) - 2(6x + 5)
A. (18x - 2)(x + 5) B. (3x - 2)(6x + 5) C. (18x + 2)(x - 5) D. (3x + 2)(6x - 5)
Mathematics