Convert to rectangular coordinates.
A. (0, 5)
B. (5, 0)
C. (-5, 0)
D. (0, -5)
Answer: D
You might also like to view...
Find the volume of the solid generated by revolving the region bounded by the given lines and curves about the  . y = 8x, y = 8, x = 0
A.  ?
?
B. 24?
C.  ?
?
D. 4?
Solve the equation. (8x - 16) =
  (8x - 4)
A. -1
B. -8
C. 1
D. 
Provide an appropriate response.The parallel dot plots show the number of fatalities per year caused by tornadoes in a certain state for two periods: 1950-1974 and 1975-1999. In addition to comparing these distributions, suggest a reason to explain any differences. 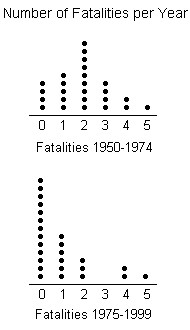
A. In both periods, the number of fatalities per year ranges from 0 to 5. During the period 1950-1974, the most common number of fatalities was 2. The distribution for this period is roughly symmetric - the number of years having more than 2 fatalities is roughly the same as the numbers of years having fewer than 2 fatalities. During the period 1975-1999, the most common number of fatalities is 0 and most years have 0 or 1 fatality. Only a few years have more than 1 fatality during this period. This could be due to higher construction standards, better warning systems, or medical advancements. B. In both periods, the number of fatalities per year ranges from 0 to 5. During the period 1950-1974, the most common number of fatalities was 2. The distribution for this period is roughly symmetric - the number of years having more than 2 fatalities is roughly the same as the numbers of years having fewer than 2 fatalities. During the period 1975-1999, the most common number of fatalities is 1 and most years have 1 or 2 fatalities. Only a few years have more than 2 fatalities during this period. This could be due to higher construction standards, better warning systems, or medical advancements. C. During the period 1950-1974, the number of fatalities per year ranges from 1 to 5 with the most common number of fatalities being 2. The distribution for this period is roughly symmetric - the number of years having more than 2 fatalities is roughly the same as the numbers of years having fewer than 2 fatalities. During the period 1975-1999, the number of fatalities per year ranges from 0 to 5 with the most common number of fatalities being 0. During this period, most years have 0 or 1 fatality and only a few years have more than 1 fatality. This could be due to higher construction standards, better warning systems, or medical advancements. D. In both periods, the number of fatalities per year ranges from 0 to 5. During the period 1950-1974, the most common number of fatalities was 3. The distribution for this period is roughly symmetric - the number of years having more than 3 fatalities is roughly the same as the numbers of years having fewer than 3 fatalities. During the period 1975-1999, the most common number of fatalities is 0 and most years have 0 or 1 fatality. Only a few years have more than 1 fatality during this period. This could be due to higher construction standards, better warning systems, or medical advancements.
Simplify the expression.
A. 
B. 
C. 
D. 