The graph of the function f is shown below. Match the function g with the correct graph.g(x) = -f(-x) - 3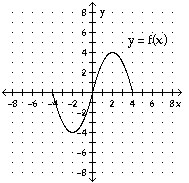
A. 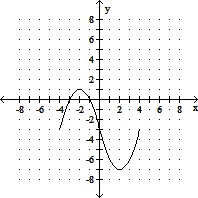
B. 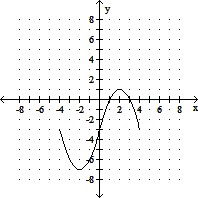
C. 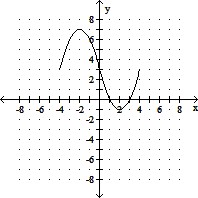
D. 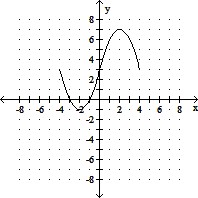
Answer: B
You might also like to view...
Provide an appropriate response.Suppose that f has a positive derivative for all values of x and that f(2) = 0. Which of the following statements must be true of the function g(x) =  ?
?
A. The graph of g crosses the x-axis at x = 2. B. The function g has a local maximum at x = 2. C. The graph of g has an inflection point at x = 2. D. The function g has a local minimum at x = 2.
Provide an appropriate response.The region bounded by the lines x = 2, x = 6, y = -2, and y = 1 is revolved about the y-axis to form a solid. Explain how you could use elementary geometry formulas to verify the volume of this solid.
What will be an ideal response?
Use a graphing calculator to find the sum.
 Round your answer to three decimal places.
A. 2.250 B. 4.499 C. 0.750 D. 4.501
Solve the problem.A new exhibit is scheduled to open at the local museum. Museum officials expect that 8000 people will visit the exhibit in its first week, and that the number of visitors will drop by 10 people per week after the first week during the first 6 months. Find the total number of visitors expected in the exhibit's first 7 weeks.
A. 47,850 visitors B. 55,790 visitors C. 39,850 visitors D. 55,730 visitors