Select the graph below that best shows the change in the market specified in the following situation: In the market for leather coats, when leather coats become more fashionable among young consumers
Assume that the graphs show a competitive market for the product stated in the question.
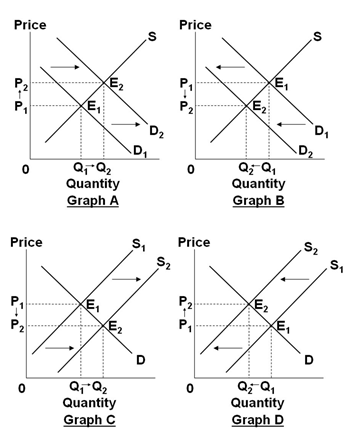
A. Graph A
B. Graph B
C. Graph C
D. Graph D
A. Graph A
You might also like to view...
The price of salsa rises. How does the increase in the price of salsa affect the supply of salsa?
A) The supply of salsa increases. B) The supply of salsa decreases. C) There is no change to either the supply of salsa or the quantity of salsa supplied. D) There is no change to the supply of salsa, but the quantity of salsa supplied increases. E) There is no change to the supply of salsa, but the quantity of salsa supplied decreases.
Refer to Table 17-5. Oil Can Harry's, a new automobile service shop, is ready to start hiring. The table above shows the relationship between the number of mechanics the firm hires and the quantity of oil changes it produces
a. Suppose the price of an oil change is $20. Complete the table by filling in the values for marginal product and marginal revenue product. b. Oil Can Harry's is an input price-taker. Suppose the wage paid to mechanics is $80 per day. What is the profit-maximizing number of mechanics? c. Suppose the wage rate rises to $100 per day. (i) What happens to the firm's demand curve for mechanics? (ii) What happens to the profit-maximizing quantity of mechanics? d. Suppose the wage rate is $60 per day and the price of an oil change is now $15. (i) What happens to the firm's demand curve for mechanics? (ii) What happens to the profit-maximizing quantity of mechanics?
Price discrimination exists when
A) a firm charges different buyers different prices for its product but the costs are the same. B) each buyer is treated equally. C) sales are made below cost. D) a firm charges each buyer a price of the product in proportion to its costs.
Table 31.1Wage rate (dollars per hour)Labor demanded (workers)Total labor cost(dollars per hour)Marginal Wage (dollars per worker)$260________---222________________184________________146________________108________________Table 31.1 shows the number of workers a firm is willing to hire per hour at different wage rates. Complete the table by computing the total wage bill (total labor cost) and the marginal wage. Assume the union collects dues of 1 percent of the total wage bill. How many workers would the union want hired in Table 31.1 if its goal was to maximize the amount of dues collected?
A. 8. B. 2. C. 4. D. 6.