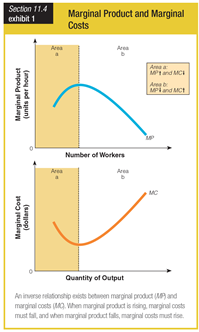
What is being displayed in the two graphs in Marginal Product and Marginal Costs?
a. When the cost of producing one more unit increases, then the marginal product is growing.
b. When the marginal product is falling, then the average total cost of output is falling.
c. When the marginal product is growing, the cost of producing one more unit is falling.
d. When the change in output per unit of input is growing then marginal costs are growing.
c. When the marginal product is growing, the cost of producing one more unit is falling.
You might also like to view...
Real GDP per person in Richland is $20,000, while real GDP per person in Poorland is $10,000. However, Richland's real GDP per person is growing at 1 percent per year, and Poorland's real GDP per person is growing at 2 percent per year. After 50 years, real GDP per person in Richland minus real GDP in Poorland is:
A. positive and greater than $10,000. B. zero. C. positive but less than $10,000. D. negative.
Refer to the figure above. The consumer surplus before the tax is imposed is given by the area ________
A) BCJ B) BAH C) CAE D) JBHF
All of the following are income in kind EXCEPT
A) government provided housing. B) government provided education. C) tips received by a waitress. D) goods produced in the home.
Frictional unemployment is
a. not inevitable; rather, it can be reduced to zero by well-designed public policies. b. not inevitable; rather, it could be reduced to zero if by the elimination of unemployment insurance. c. inevitable, because at any given time, jobs are being created in some firms and destroyed in other firms. d. inevitable, because in some industries, wages are always set above the level that brings supply and demand into equilibrium.